The City By The Sea may be pretty, but it sure is expensive.
That realization isn’t news to anyone who lives here but the scale of that expense may still take locals by surprise based on a pair of recent surveys tracking housing costs and household bills.
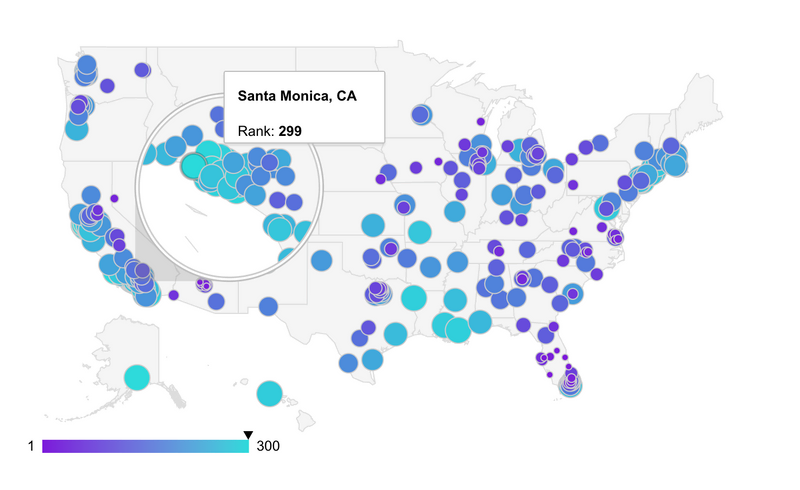
A ranking by WalletHub lists Santa Monica as the second worst city in the country for new homebuyers.
The city came in at 299 out of 300 cities ranked on a variety of metrics across affordability, the real estate market and quality of life. Santa Monica was dead last for affordability and came in at 281 for its real estate market and quality of life.
Of particular weight in sinking Santa Monica’s score is the property-crime rate ranking (261/300), homeownership rate for Millennials (294/300), housing affordability (239/300), cost of living (253/300), cost per square foot (293/300) and rent-to-price-ratio (300/300).
Only Berkeley scored worse although Santa Barbara was close with a ranking of 297 and Los Angeles came in at 296.
Florida dominated the top of the list taking the first five spots with Palm Bay, Cape Coral, Tampa, Port St. Lucie and Orlando. Roseville was the highest ranking city in California at 44.
When people can afford to move here, they'll pay more for just about everything else once they arrive. In an analysis of various bills, Santa Monicans pay more than the regional average in almost every way.
Bill paying platform doxo tracks a variety of household expenses based on anonymized bill pay data consisting of actual bill payment activity to confirmed household service providers and their recent report sheds some light on Santa Monica’s expenses.
According to doxo, the average monthly bill (including housing, utilities, auto, insurance, phone, insurance, security and cable) is $3,355 in the city compared to $2,046 for the region.
Locals pay more in every category except average auto loan bills ($322 locally vs. $467 for the region).
Housing has the largest disparity with locals paying a monthly average mortgage of $3,637 while the region pays an average of $1,321.
All told, Santa Monicans are paying $15,705 more (64%) than the national average per year for those services. The city ranks as the 116 most expensive out of the 431 tracked in California. Pacific Palisades is 28th at $3,853, Malibu comes in at 30 with $3,840 and Beverly Hills is 46 with $3,725. San Ramon is first with a combined bill of $4,390.
Buying a First Home in Santa Monica (1=Best; 150=Avg.):
239th – Housing Affordability
39th – Real-Estate Tax Rate
253rd – Cost of Living
300th – Rent-to-Price Ratio
145th – Median Home-Price Appreciation
77th – Foreclosure Rate
261st – Property-Crime Rate
82nd – Total Home-Energy Cost
Average Bills
19% have a mortgage at an average payment of $3,637 compared to the regional average of $1,321.
Rent:
70% pay rent with an average monthly bill of $2,055 compared to $1,191 regionally.
83% have an auto loan with an average payment of $322 compared to $467 regionally.
86% are paying health insurance with an average cost of $151 compared to $120 regionally.
100% pay a monthly phone bill with a cost of $137 compared to $119 regionally.
85% pay a monthly cable/internet bill of $133 compared to $118 regionally.
30% carry life insurance with a monthly bill of $326 compared to the regional average of $89.
12% pay a monthly alarm & security bill of $153 compared to $84.
86% are paying auto insurance with an average cost of $208 compared to $207 regionally.
76% report paying utilities with an average cost of $373 compared to $351 regionally.


