Santa Monica’s total vacancy rate, including single family homes and multi-unit housing could be as high as 10 percent according to new data released by the State of California’s Department of Finance this week.
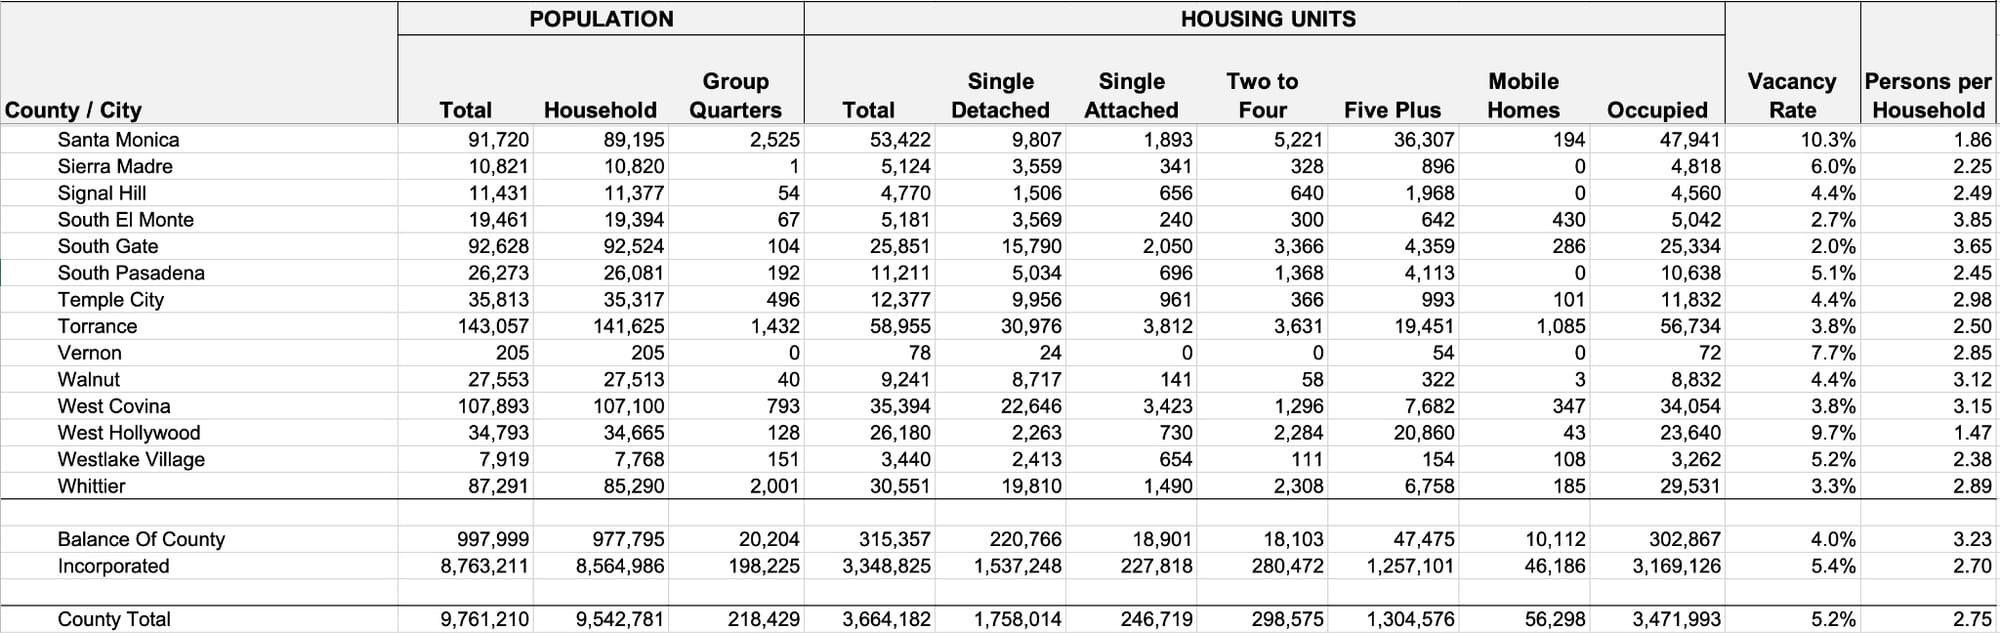
According to the State, Santa Monica’s 2023 population was 91,720 with a total of 53,422 housing units for an average household size of about 1.86. Of those units 47,941 are occupied for a vacancy rate of 10.3 percent. Of the total housing units, the Department of Finance figures report 11,700 are "single" units, 194 are mobile homes with the rest in multi-unit properties.
Santa Monica’s vacancy rate is driven in part by the local expression of a statewide trend: declining population and increased construction. The local population declined by about 1,600 people in the past three years while the city built 793 housing units.
In the past year, Santa Monica’s population was essentially stable with just 19 people leaving the city. Santa Monica was one of 356 cities to lose population while 125 gained population and one had no change.
Across the state, pandemic era trends of population decline also slowed with California reporting a 0.35-percent population decline for 2022, roughly 138,400 persons (down from about half a percent).
According to the State, stable births, fewer deaths, and a rebound in foreign immigration slowed California’s population decline in 2022, with the state’s population estimated at 38,940,231 people as of January 1, 2023. Over the same period, statewide housing growth increased to 0.85 percent – its highest level since 2008. California added 123,350 housing units on net, including 20,683 accessory dwelling units (ADUs), to bring total housing in the state to 14,707,698 units. New construction represents 116,683 housing units with 63,423 single family housing units, 51,787 multi-family housing units, and 1,473 mobile homes.
While more people were born than died, and foreign immigration nearly tripled, the total population decline was due migration out of the state.
"With slower domestic in-migration and increased domestic out-migration likely the result of work-from-home changes, declines in net domestic migration offset the population gains from natural increase and international migration," said a report from the Department of Finance.
Forty-six of the state’s fifty-eight counties lost population. The ten largest percentage decreases were: Lassen (-4.3 percent), Del Norte (-1.3 percent), Plumas (-1.2 percent), Santa Cruz (-1.0 percent), Marin (-1.0 percent), Tehama (-1.0 percent), Napa (-1.0 percent), Lake (-0.9 percent), Monterey (-0.8 percent), and Los Angeles (-0.8 percent).
Ranked by net housing gains, Los Angeles (19,556), San Diego (7,034), Oakland (4,005), San Francisco (2,823), and Unincorporated Riverside County (2,106) added the most housing units in 2022.
Larger densely populated urban areas built most of the multi-family housing throughout the state. Los Angeles led the state gaining 12,074 multi-family units, comprising 61.7 percent of their net housing growth, followed by San Diego (4,568 for 64.9 percent), Oakland (3,880 for 96.9 percent), and San Francisco (2,573 for 91.1 percent).
The new data was released by the state as part of an annual process to enable state and local agencies to use the information for planning purposes. The data is based on the 2020 census.
"Housing units are estimated by adding new construction and annexations and subtracting demolitions, and adjusting for units lost or gained by conversions," said the report. "Annual housing unit change data are supplied by local jurisdictions and the U.S. Census Bureau. Occupied housing units are estimated by applying a derived civilian vacancy rate to the estimated civilian housing units."
The changes to the housing stock are then combined with occupancy levels and household totals to prepare the annual city population estimates.