Santa Monica’s mix of rent controlled and market rate housing make it difficult to find unified data on the housing picture but some data is available for both kinds of units.
Commercial rental companies track apartments that come through their platforms storing information on rent trends and vacancy rates.
According to Apartmentlist.com, rents in Santa Monica have increased 3.4 percent year over year and are up by about 0.7 percent since the start of the pandemic.
The company lists the median rents in Santa Monica as $2,061 for a 1-bedroom apartment and $2,568 for a two-bedroom.
Rent controlled units reset to market rate upon vacancy and the Rent Control Board (RCB) keeps track of those trends. According to the RCB, median market rate rents continue to climb with studio, one and two bedroom units all surpassing pre-pandemic levels. Last year, their data listed a studio as renting for $2,020, a one bedroom for $2,500, a two-bedroom for $3,400 and a three-bedroom for $4,372.
According to Apartmentlist.com, Santa Monica has the third highest vacancy rate among California areas it tracks.
The company tracks cities and counties based on listings through their platform. The monthly vacancy index for a given location is calculated by taking an average of the daily vacancy rates for each property and then averaging the rates of all the properties that fall within the bounds of the given location (city, county, metro, state, or national), weighted by the number of units in each property.
They exclude newly listed buildings due to their propensity to have inflated vacancy rates during their first few months of listing. The listing is weighted toward larger multi-unit properties which they said increased their confidence in the larger trends but creates the possibility that properties with a handful of units might have different trends.
For California cities, the city of Mountain View had the highest vacancy rate at 10.2 percent followed by Oakland at 10 percent. Santa Monica came in third at 8 percent followed by San Francisco and Los Angeles at 5.6 percent. For California counties, Alameda was at the top with 6.5 percent followed by Contra Costa at 6.1 percent, San Francisco County at 5.6 percent, Santa Clara at 5.5 percent, Solano and Los Angeles at 5.3 percent.
Glendale had the lowest rate at 3.9 percent. Nationally, the list tracks the country’s vacancy rate as 6.5 percent and California’s overall rate as 5.1 percent.
While Santa Monica’s vacancy rate is high, the region continues to build new units. According to Point2 Homes, an international real estate search portal, the Los Angeles Metro area issued 32,593 permits for new construction last year. Of those, 19,559 were for projects with five or more units and 10,996 were single family homes. Statewide, California issued 118,090 permits according to the site with 50,993 for units of 5 or more and 62,937 for single family homes.
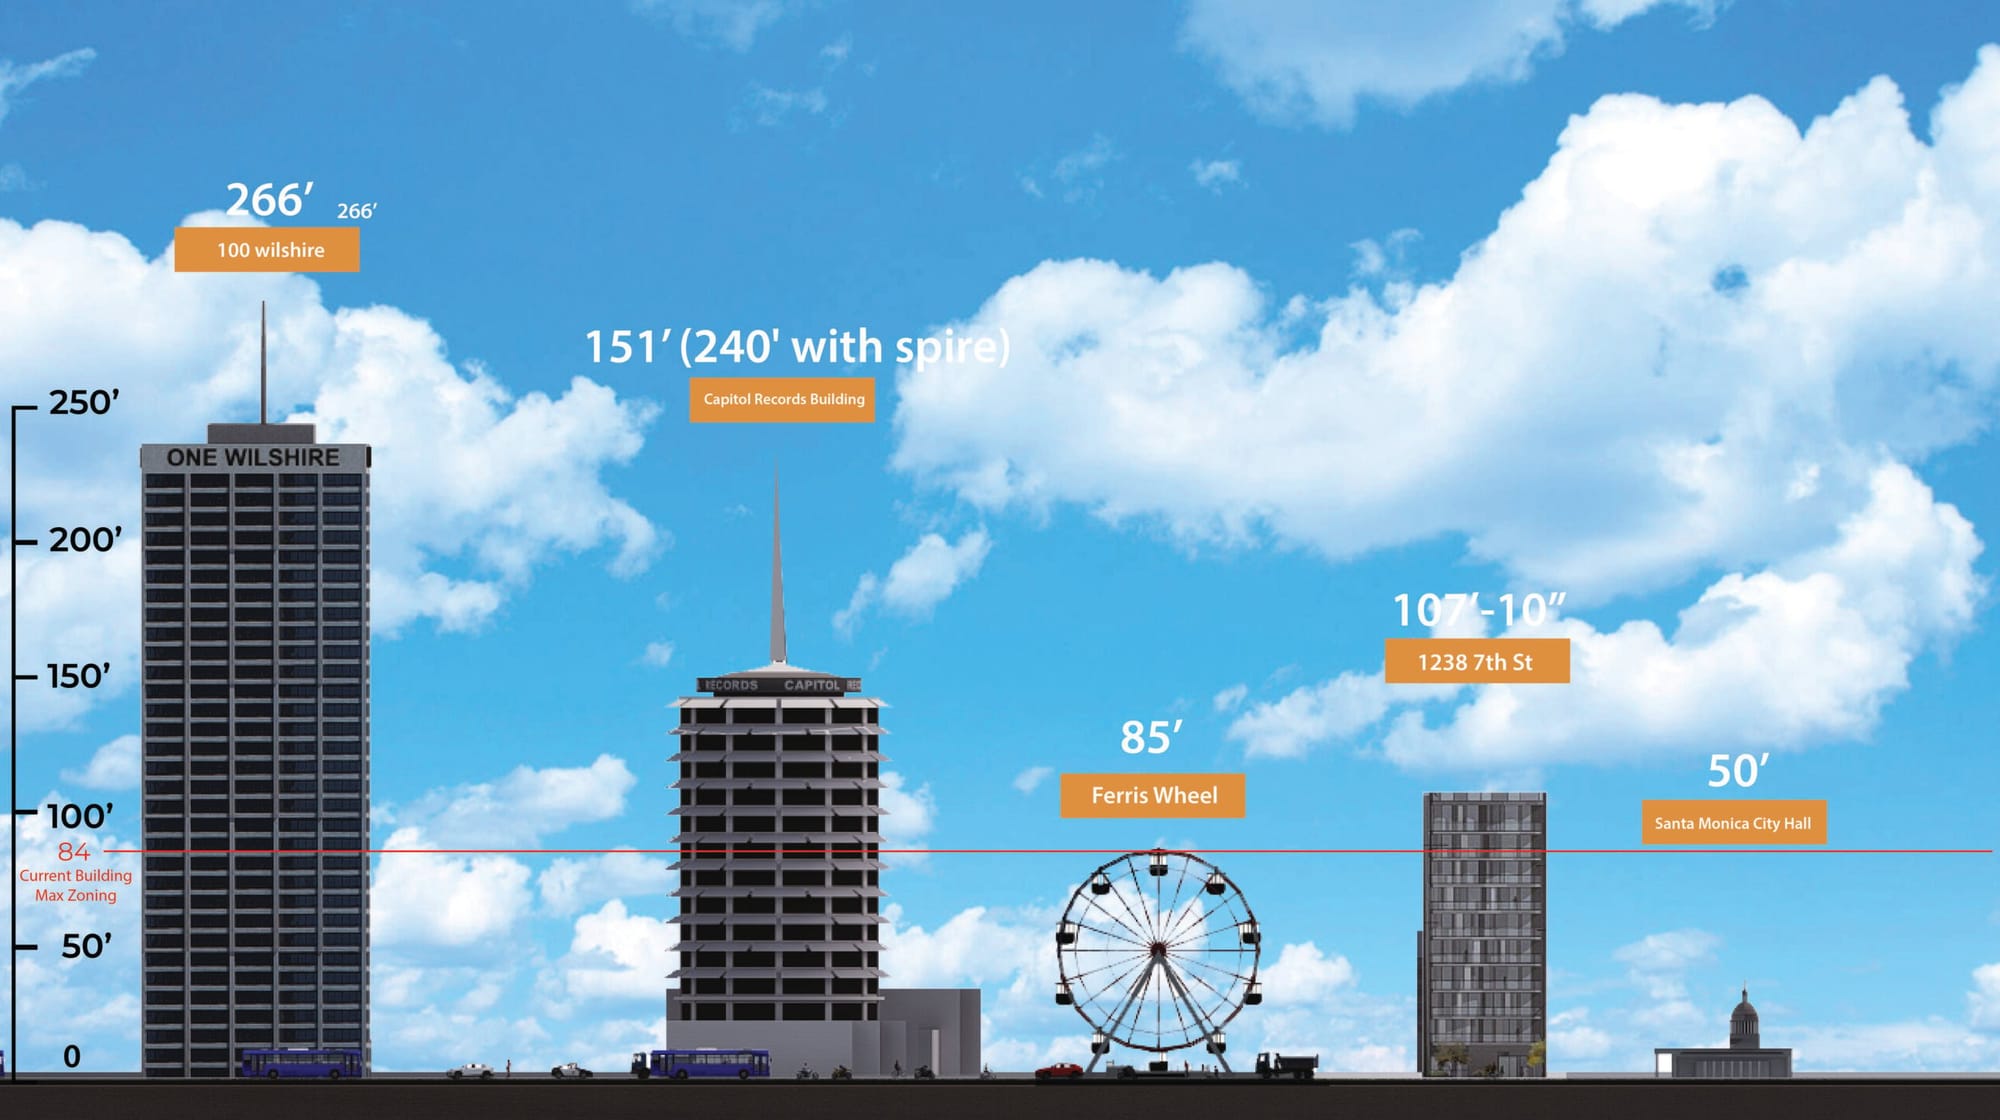
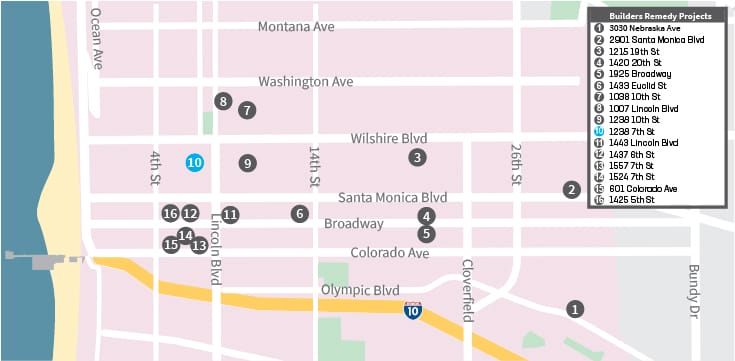
While there’s no guarantee all, or any, of the Builder’s Remedy projects get built, if all 16 were to open, they’d add about 4,500 units to the city.